
Data Collection/Analysis
The four data points I selected for my research were chosen because, within my second-grade classroom, the highest academic need was in reading. After looking into MAP scores, and benchmarking data I realized that reading was a need in my classroom. Once I dug deeper into MAP data using the students’ profiles, I determined that comprehension was where my students needed the most instructional support and focus. A lot of my students were able to read fluently with high accuracy, but couldn’t recall details of what they had read. By using anecdotal notes, and running records I was able to keep a close eye on my students reading behaviors such as fluency, accuracy, and comprehension. Using a reading interest survey allowed me to adjust my instructional strategies toward my students' interest, in return, increase student engagement. The benchmark test was best for my students because was something that showed growth over time, determined their instructional reading level, and my students were familiar with the process. All of my data points allowed me to learn each student as a reader to help develop strategies to increase their reading achievement. Comprehension is a vital skill, not only in reading but across all subjects so I knew I needed to do something about the lack of comprehension skills in my classroom.

Pre/Post Test
The first data collection method utilized was a pre and post test from district-mandated curriculum. This was a benchmarking test that required students to read leveled text and answer targeted comprehension questions to determine what level the student was able to read instructionally. The instructional level meant that the text was not too easy for the student but was not too hard, either. This test was a reliable piece of data that showcased my students’ reading skills, within their specific level. This test allowed me to see the growth, or lack of growth, that was being made with my students’ comprehension skills during the length of my study.

The chart to the left is a key to reading the graph below. On the left of the chart, the Fountas and Pinnell reading levels are listed, on the right is the number that represented that Fountas and Pinnell level on the graph below. Students are identified as letters on the graph below.
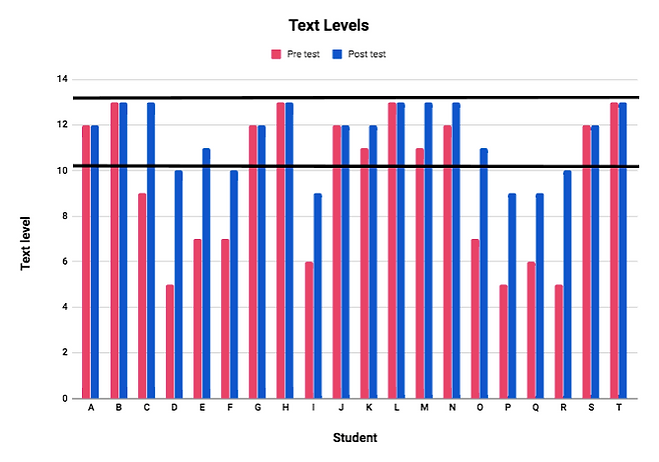
I chose to use this as my pre and posttest for my action research so I could see the shift and growth in my students. The two tests were exactly the same. The same questions were asked but using different fiction and nonfiction passages to determine if my students showed growth in reading levels. This graph shows the results of the pre and post benchmark assessment. The pink represents the score each student received on the benchmark pretest. The blue represents the score each student received on the benchmark post-test. Students should enter second grade at a level J and exit second grade at a level M. Both level J (10) and Level M (13) were marked on the graph with black lines to identify the grade level gap. 14 of my 20 students were able to fall within that gap by the end of my study. The data showed that most of my students grew 2-4 reading levels over the duration of my study. Six students were below grade level at the end of the study, but they still increased their reading levels and were closer to being on grade level. This told me that there was a lack of comprehension skills that was blocking my students from moving reading levels and increasing their reading achievement. This showed, as a class, we were able to improve during this study.

Benchmark testing form

Running Record Assessment Form
Running Records
The second data collection method was running records. On Fridays, running records were given to my students based on a warm read. A warm read is a text to which the student has already been exposed. After the running record was complete, I was able to ascertain my students’ accuracy, fluency rate, and comprehension. The comprehension on a running record was scored on a targeted-question rubric. The rubric included questions which were within the text, beyond the text, and about the text. If a student was able to give a plethora of information from a section of the rubric they would receive the highest score which was a 3. If the student wasn’t able to give any information they would receive a 0. Any information in between allowed the student to receive a 1 or a 2. All three sections were scored the same way making the cumulative score out of 9. After each running record was performed I was able to use the student data to adapt my instruction to appropriately meet the specific needs of my students. I used this data as I created lesson plans and instructional goals for myself and students. Individual students and I were also able to use the running record data to select individual reading goals. If I saw they were mastering a strategy related to their reading goal during whole or small group instruction they received a star on their chart and we would work to create a new goal.
Teal Group

This graph shows the running record comprehension test data for each of the students in my teal reading group. This was one of my below grade level groups so I met with them for twenty minutes every day. The comprehension test consisted of three sections to determine understanding; within the text, beyond the text, and about the text. Each section was scored 0-3 based on the student's response. This was why the test was scored out of nine. The highest score they could receive on a comprehension test was nine. The lowest they could receive was a zero. This data told me if my students in this group understood what they were reading or not. It also provided me with indications of what I needed to reteach in the next small group.
When looking at this graph student Q started at a two for comprehension and made huge growth. She went from being able to tell very few details about the story (2) to being able to remember important details (4). Then I noticed a large dip in this student's scores. After looking back at the data and the dates of when the comprehension test was given I realized that this student had been gone for two days prior to the test. This told me that this student relied on that warm read and group discussion in order to comprehend what they were reading. Once this student was able to return to school I saw a huge increase in growth in her reading achievement. This was a commonality in all the students in this group. A lot of them were sick or gone from school which caused a decrease in growth. I had to do a lot of reteaching in this group to help them through the days that they missed but I did see growth in their reading achievement overall.

Blue Group

This graph shows the running record comprehension test data for each of my students in my blue group. This was one of my on grade level reading groups so I met with them twice a week. The comprehension test consisted of three sections to determine understanding; within the text, beyond the text, and about the text. Each section was scored 0-3 based on the students' response. This is why the test was scored out of nine. The highest score they could receive on a comprehension test was nine. The lowest they could receive was a zero. This data told me if my students in this group understood what they were reading or not. It also provided me with indications of what I needed to reteach in the next small group.
There was a commonality within this group from weeks 2 and 3. We had two days off from school during these two weeks so I was not able to meet with students for guided reading. I think this was why there was a whole group dip in the data between weeks 2 and 3. Overall the group showed growth in their reading comprehension. I started to notice them using more strategies from small group when they were independently reading and when we were doing whole group reading. This group of students was my shy group. They didn't like to answer questions during the discussion of the text for fear they would get the answer wrong. I provided them with strategies, such as using sticky notes to mark important information in the text, to help build their confidence in answering questions. By the end of this study, all of them were raising their hands and participating in discussion questions. I believe they grew in their comprehension skills because of this.
Orange Group
This graph shows the running record comprehension test data for each of my students in my orange group. This was my above grade level reading group so I met with them twice a week. The comprehension test consisted of three sections to determine understanding; within the text, beyond the text, and about the text. Each section was scored 0-3 based on the student's response. When looking at student J there was a significant dip in their score between week 2 and 3. During the day of this assessment, this student was removed from the classroom for behavior.

Therefore when entering the room for guided reading he was upset and was shut down. This impacted his assessment score because his attitude was not positive at that moment. He did not want to read the book so he just based his answers off pictures. After we got through this assessment he turned around his attitude and began to make huge growth by participating in small group. Student B also had a large dip in their scores from week three to week five. He also had behavior issues that impacted his reading. This student was distracting to others, during group, so he had to be asked to leave. This made him shut down and refrain from reading the story one on one with me. He chose to read the story on his own and then took the assessment. He was not exposed to the strategies that were taught during group those two weeks. I believe that was why there was a dip in his comprehension scores. Overall I saw tremendous growth within these students. When I first started my action research these students were already strong with comprehension but they lacked the strategies to make inferences and to synthesize. At the end of my action research, my students were making inferences during small group and whole group without being asked. They were synthesizing the stories they read with their peers without being asked. These students were able to take strategies that were taught from small group and give them purpose within their own independent reading.
Purple Group
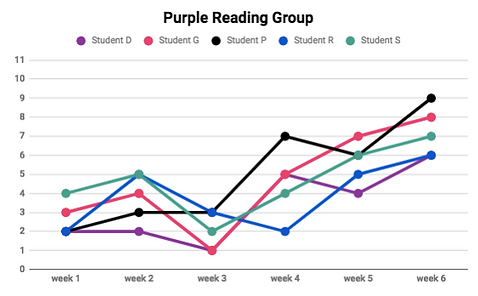
This graph shows the running record comprehension test data for each of my students in my purple group. This was one of my below grade level reading groups so I met with them twice a week. The comprehension test consisted of three sections to determine understanding; within the text, beyond the text, and about the text. Each section was scored 0-3 based on the student's response. Student D, student P, and student R were receiving reading interventions from the reading specialist at our school. There was a common dip in data between weeks 2 and 3. We had a total of three days off between these two weeks due to district breaks, and snow days.
These students missed three days of small group instruction and reading intervention instruction. That was why I think there was a dip in the data during these two weeks. These students relied on consistency and repetition. Missing even one day threw them off track so missing three days caused a major impact on learning. Student R was a student who was receiving instruction in small group, reading interventions, and one on one with me. This student had a really hard time focusing during instruction. He was removed from reading interventions for a short period due to hyperactive behaviors that distracted his peers from moving forward with their reading skills. Due to him being below grade level I decided to start seeing him one on one for twenty minutes, every day, and in small group for twenty minutes daily. Receiving that forty minutes of instruction that was differentiated for his level of skills really helped his reading achievement. He was able to decode words on his own and could even give complete summaries of what he had read. After seeing this growth in him, the reading specialist and I decided that it was time for him to start receiving reading interventions again. The reading specialist started seeing this student one on one for twenty minutes a day on top of the forty minutes I was already instructing him. Once this was set in stone this student really took off. He started flying through reading levels. By the end of my study, he was on the same level as everyone else in his small group. I focused my lessons on self-correcting, solving words, and maintaining fluency with this group. I knew they had to build up their basic reading skills in order to fully comprehend a text that they were reading. They all showed growth in their comprehension skills during this study.
Reading Interest Survey
The third data collection method was a reading interest survey given to all twenty students. This survey asked the students their feelings towards recreational and educational reading. The students were able to strongly agree, agree, disagree, or strongly disagree with the questions asked. Through this survey, I was able to understand each of my student’s true feelings toward reading when they were inside the classroom and outside of the classroom. Knowing this information helped me understand my student’s attitudes in small group reading and how to approach reading with each of my students.
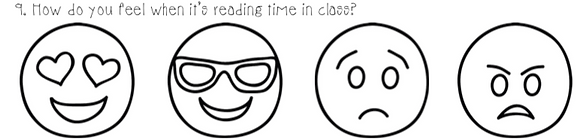
The reading interest survey was administered to my class at the beginning of my research and at the end of my research, as a whole group. The students were given an explanation on how to answer the questions and what each emoji meant. The students were encouraged to answer truthfully and to not answer how they think they should. The reading interest survey was an assessment given to understand my students’ feelings regarding reading in the classroom and reading recreationally. This survey allowed me to understand each student’s personal feelings and attitudes toward reading that they may not have expressed to me. There were 10 questions within the survey where the students answered using an emoji Likert scale. Each emoji represented an emotion of the question, such as strongly dislike, dislike, like, and strongly like. After receiving the results from the reading interest survey, I looked at each question and took data on how my students answered. This data is displayed and explained in the graphs below This survey was necessary for my study because I wouldn't have known my students' feelings toward reading without it. Attitude is a big part of growth in academics. Having a positive mindset can grow much faster than a negative mindset.
Pre study results

Post study results

The first question that stood out to me from the survey was "How do you feel when you read out loud in class?" For me as a teacher, as a teacher, I wanted to hear my kids read and I wanted them to feel confident in themselves to read in front of their peers. When I realized 80% of my class did not like to read out loud in class I knew I needed to do something about that. In my small reading groups, I began to implement strategies that would build their confidence in reading such as a personal invitation to read. A personal invitation to read was me modeling how to read the book first then asking the student to read the book with me. I would then let them practice reading out loud to me until they felt comfortable reading the book by themselves. I would then invite the student to read the book to the class. If the said no I would ask them if there was another person in the building they would like to read to. If they said yes I would let them sit on my special teacher chair to read to the class. My hope in doing this was that the student would have been previously exposed to the text and possible errors would have been corrected in working one on one with me. Therefore they would have confidence when reading to a group. I started to notice more and more of my students asking me to read to the class daily. By the end of my study, 15% of my class strongly liked to read out loud, 70% of my class liked to read out loud and 15% of my class still disliked reading out loud. I was proud to see the confidence grow in my students as readers.
Pre study results

Post study results

Another question from the survey that stood out to me was how many of my students strongly liked listening to reading. For example, a question on the survey asked, “How do you feel when you listen to a story?” 18 of my 20 students said that they strongly liked listening to stories and the other 2 students answered that they liked listening to a story. After looking at the results of that question I recognized I needed to do more read alouds in class. Reading aloud to my class helped demonstrate good fluency when reading. Once I began modeling how I read in class I noticed more and more of my students started to follow in my footsteps. For example, I liked to change my voice for each character in a book when I read out loud. My students started to do the same thing in small group, without me telling them to.I think once they heard me doing it their confidence started to grow. Once they started to try these different things that I was doing during read alouds I noticed their comprehension started to increase as well. Changing the voice of each character helped them to remember the characters and their purpose. This was an unintended byproduct of my study. The data showed me that read alouds were something my students really enjoyed, therefore, I altered my teaching to include more read alouds which then increased my students' achievement by allowing them to have a good role model in reading. I used the strategies from small group within my read alouds to show my students what I expected of them. Once I did this I noticed my students started to do it within their own reading as well. Students answered the same reading interest survey at the end of my study. When asked the same question "How do you feel about listening to a story?" all 20 of my students answered that they liked listening to stories. I believe this score increased because I built my students' confidence in reading. I showed them that reading could be fun.
Anecdotal Notes
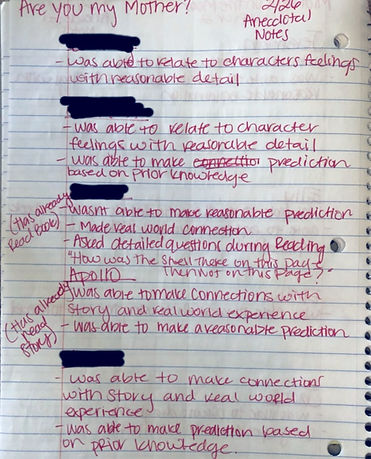
The fourth data collection method was anecdotal notes. Anecdotal notes were used to record specific observations of individual student behaviors, skills, and attitudes as they read. I used anecdotal notes with my students to observe comprehension while reading diverse leveled-text. These observations helped me develop an understanding of my students both as individuals and as a small group. I was able to identify patterns, that were acting as roadblocks to reaching comprehension of the texts, among my students in each small group. I was then able to pre-plan lessons that targeted those roadblocks. Once my students achieved their targeted reading goal I would reassess their progress, using anecdotal notes, and use that data to choose a new reading goal.
Anecdotal notes was a form of data that was collected each day over the course of six weeks. The observations that were made were different based on every student. These observations showed different reading behaviors that showed the strengths and weaknesses of every reader. I targeted my anecdotal notes toward comprehension in each group with the exception of my purple group, I focused on self-correcting, and decoding skills for them as well as comprehension notes. An example of an observation that I made of a student making appropriate growth in comprehension was within my orange group. The student was able to make connections outside of the book and was able to make feasible predictions. An example of an observation that I made of a student not making the appropriate growth was a student in my teal group. This student made comments about things that had nothing to do with the story or the question that I was asking. If I had not collected these observations I wouldn't have known my students as readers as well. I also would not have been able to know what they were struggling with as individuals.

Anecdotal notes
Anecdotal notes
Anecdotal notes
Triangulated Data
When looking at all three data collection methods the data from each method enriched one another. The data shows, in all three collection methods, that the students grew in their reading by increasing book levels, and running record assessment scores. The use of targeted questioning, during guided reading, created growth but also translated over to whole group instruction and the students overall reading achievement. The decrease in scores did explain that changing levels of texts, switching between fiction/nonfiction, and missing school affected the students' comprehension. Anecdotal notes and running records enriched the growth from the benchmark test. These two data methods showed small growth in comprehension over time which confirmed the benchmark results. The benchmark test showed a larger amount of growth from the study as a whole which confirmed the strategies that were used during guided reading. The three data methods did confirm that the use of preplanned differentiated targeted questioning increased overall reading achievement as students showed growth in benchmark testing.
Student Impact
Throughout this study, student impact was made due to the strategies that were implemented in guided reading such as targeted questioning during discussion. Before this study, students would be very quiet during small group instruction and I had to do a lot of probing to get my students to answer my questions. After my study of pre-planned, differentiated, and targeted questioning was complete student engagement was at its peak. Students began helping each other find the answer to my questions. They began letting others find the answer before just shouting the answer out loud. They started asking their own questions. By doing this they displayed a higher level of thinking than they were prior to my study. My students wanted to have their voice heard not only in small group but in whole group reading as well. I began to see my students who previously would just sit and stare into space during instruction start to speak up and voice their thoughts. These kinds of things allowed my students to make connections between the text and their learning. Students began to be curious as to why books were written a certain way or why an illustrator might have made the pictures the way that they did. Once my students became curious about the text their scores reflected that. Implementing strategies and targeted questioning engaged my students and made them excited to read which increased their reading achievement.